
The Logistics Nexus: Inside the Intermodal Terminal
Explore the hub where road meets rail. Discover how Intermodal Terminals optimize global logistics through efficient transloading, gantry cranes, and seamless connectivity.
⚡ In Brief
- The intermodal terminal’s fundamental economic value is the time-cost of the modal exchange: When a container moves from ship to rail to truck, each exchange is a period during which the cargo generates no revenue but incurs cost — crane time, dwell time, equipment depreciation. A large automated port terminal (Rotterdam Maasvlakte II) completes a ship-to-rail transfer in approximately 45 minutes per container, including inland train loading. A small manual inland terminal may take 4–6 hours for the same sequence. The difference — 3–5 hours of dwell time per container — at a container daily cost of €15–25 represents €2–4 of direct economic loss per exchange, multiplied across a shipper’s full container flow, that determines whether rail intermodal is cost-competitive with direct road haulage on a given corridor.
- The crane cycle time is the primary throughput constraint at any rail intermodal terminal: A Rail Mounted Gantry (RMG) crane performing a container lift from train to truck or truck to train takes approximately 120–180 seconds per lift cycle under good operating conditions — hoist, travel, position, lower, release, return. For a terminal handling 40 trains per day with an average of 40 containers per train, the required gross lift rate is 40 × 40 / (24 × 3,600) = 0.0185 lifts per second = one lift every 54 seconds continuous, requiring at minimum 2–3 cranes operating in parallel to achieve the required throughput with adequate dwell margin. This crane-to-throughput relationship drives the capital cost of terminal expansion: adding 25% throughput to a capacity-constrained terminal typically requires adding one RMG crane (capital cost €3–6 million) plus the associated runway extension and power supply.
- Ro-Ro (Roll-on/Roll-off) terminal operations are fundamentally different from Lo-Lo (Lift-on/Lift-off) in speed and infrastructure: In a Lo-Lo terminal (the conventional intermodal container terminal), containers are lifted vertically by crane — each container must be hoisted, moved, and lowered. In a Ro-Ro terminal (a variant used for complete trailers, swap bodies, and unaccompanied semi-trailers), vehicles drive or are towed horizontally onto the train wagon and secured without any crane involvement. A Ro-Ro loading cycle for an unaccompanied trailer takes approximately 10–15 minutes compared to 2–3 minutes per container in a fully automated Lo-Lo terminal — making Ro-Ro slower per loading unit for containers, but enabling handling of non-crane-liftable cargo (oversize, fragile, liquid-filled trailers) and eliminating the crane capital cost entirely.
- The P400 gauge restriction on European rail lines is the single biggest constraint on intermodal growth in France and much of Southern Europe: ISO containers are 2,438 mm (8 ft) wide and 2,896 mm (9 ft 6 in) tall for “high-cube” variants — the dominant unit in deep-sea shipping. On gauge-clearance routes rated P400 (the UIC kinematic gauge that represents the minimum clearance envelope for conventional intermodal freight), high-cube containers can be carried on standard well-wagons. But on routes limited to P/C70 or P/C80 gauge (historic routes with narrow tunnels, bridges, or overhead structures), high-cube containers cannot pass — limiting rail intermodal to the smaller “standard height” containers (8 ft 6 in = 2,591 mm) that are increasingly rare in deep-sea shipping. The inability to carry high-cube containers on key routes (including significant portions of the French, Italian, and Spanish conventional rail networks) means that cargo arriving at Atlantic/Mediterranean ports in high-cube containers cannot transfer to rail on many inland corridors — forcing road haulage. Tunnel enlargement and gauge clearance programmes (including the ongoing Montgenèvre and Mont Cenis corridor projects) address this constraint but at very high civil engineering cost.
- The New Silk Road (China–Europe rail) has created a new category of intermodal terminal — the transcontinental rail hub: The China–Europe block train services operating via the Trans-Siberian and through Kazakhstan since 2011 (with volume exceeding 15,000 trains in 2021) require terminals at the eastern boundary of the European standard-gauge network — Brest (Belarus/Poland), Małaszewicze (Poland), and Dostyk/Khorgos (Kazakhstan/China) — where containers are transferred between gauge systems (1,520 mm Russian/Chinese broad gauge and 1,435 mm European standard gauge). These gauge-change terminals process thousands of containers per day through a combination of crane transfer and wheelset exchange (where the wagon bogies are changed, allowing the wagon body to continue), and have become critical nodes in global supply chains for electronics, e-commerce, and automotive parts.
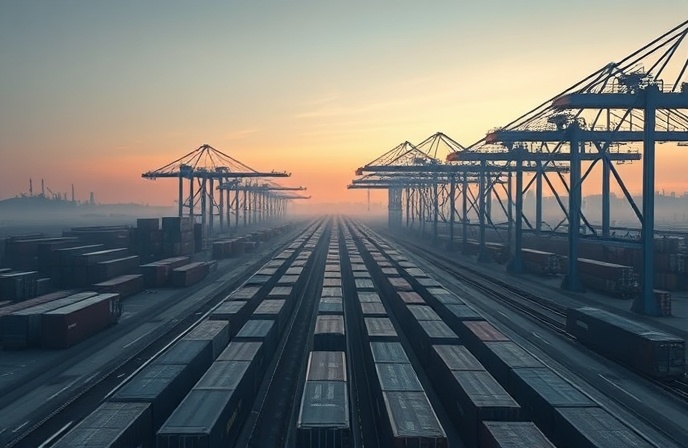
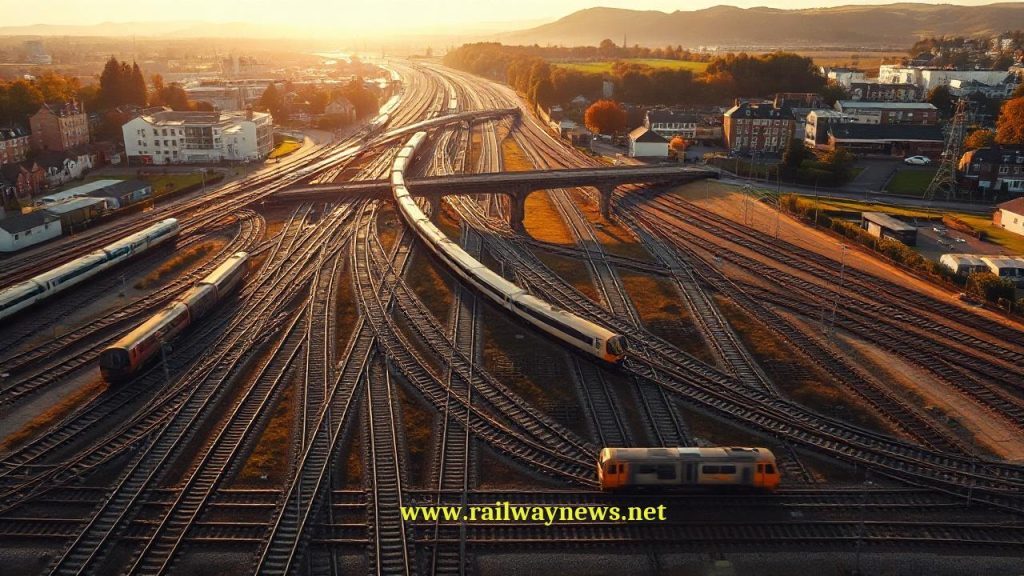
The congestion event at the Port of Felixstowe in October–November 2021 — when a combination of post-pandemic demand surge, container imbalance, and HGV driver shortage caused container dwell times to rise from the usual 3–4 days to over 28 days, with over 50 vessels waiting at anchor in the approaches — illuminated, with unusual clarity, what happens to a supply chain when the modal exchange point fails. Felixstowe handles approximately 48% of the UK’s deep-sea containerised imports. The rail freight terminal within the port — operated by Freightliner and DB Cargo, with connections to inland terminals at Lawley Street (Birmingham), Trafford Park (Manchester), and Doncaster — was handling approximately 3,800 TEU per day by rail when the congestion began. As the port’s landside storage capacity filled and lorry queues extended 7–10 km onto the A14, the rail capacity — which can move containers at approximately 400 TEU per train, with multiple trains per day, directly to inland distribution centres without using the congested A14 — became visibly the only realistic route to move cargo out of the port at scale. Freightliner increased services from 8 to 14 trains per day within three weeks. The Felixstowe episode was widely reported as an HGV driver shortage crisis and a Brexit supply chain problem — both of which were real contributing factors. But its structural lesson was about the terminal itself: a port’s intermodal rail terminal is not a convenience feature or a modal-shift aspiration — it is infrastructure redundancy, a second throughput pathway that becomes the primary one when the first is saturated. The terminals at Felixstowe’s rail head, at Rotterdam’s Maasvlakte rail connection, and at Hamburg’s Altenwerder automated terminal exist not just to move containers efficiently in normal operations — they exist to provide system resilience when normal operations fail. Understanding how intermodal terminals work, what constrains their capacity, and why they are underdeveloped relative to their potential is the foundation of any serious discussion about freight resilience.
What Is an Intermodal Terminal?
An intermodal terminal — also called a container terminal (in port contexts), inland container depot (ICD), combined transport terminal, or in North American usage, an intermodal facility or ramp — is a facility where standardised loading units (ISO containers, swap bodies, semi-trailers, or complete road vehicles) are transferred between two or more modes of transport, with rail being one of the modes. The terminal does not handle the cargo inside the units — it handles the units themselves as indivisible physical objects. Its core function is the modal exchange: lifting, positioning, and handing a container from one transport mode to another with the minimum possible dwell time and cost.
The governing international standards for intermodal loading units are ISO 668 (series 1 freight containers — classification, dimensions, and ratings), ISO 1496 (freight container construction requirements), and UIC 596-5 (technical requirements for intermodal loading units carried by rail). In Europe, the Combined Transport Directive (Council Directive 92/106/EEC as updated) provides the regulatory framework for intermodal rail freight services. Terminal design and operational standards in Europe are guided by UIRR (International Union for Road-Rail Combined Transport) specifications and ERA’s (European Union Agency for Railways) Technical Specification for Interoperability — Freight Wagons (TSI WAG).
The Standard Unit: ISO Container Dimensions and the TEU
The ISO container is the universal loading unit of global freight — a standardised steel box whose external dimensions are fixed by ISO 668, allowing it to be carried interchangeably on containerships, flatbed rail wagons, and road vehicles worldwide without any modification to the cargo, the container, or the carrying vehicle (beyond compliance with the relevant loading gauge). The foundational unit is the Twenty-foot Equivalent Unit (TEU) — a container 20 feet (6.096 m) long, 8 feet (2.438 m) wide, and 8 feet 6 inches (2.591 m) tall in standard height, or 9 feet 6 inches (2.896 m) tall for “high-cube” variants.
ISO container standard dimensions:
20 ft standard: 6,058 × 2,438 × 2,591 mm (L × W × H) = 1 TEU
40 ft standard: 12,192 × 2,438 × 2,591 mm = 2 TEU
40 ft high-cube: 12,192 × 2,438 × 2,896 mm = 2 TEU (hi-cube)
45 ft high-cube: 13,716 × 2,438 × 2,896 mm = 2.25 TEU
Maximum gross weight: 30,480 kg (20 ft); 32,500 kg (40 ft)
Tare weight (empty): ~2,200 kg (20 ft); ~3,700 kg (40 ft)
Maximum payload: ~28,200 kg (20 ft); ~28,800 kg (40 ft)
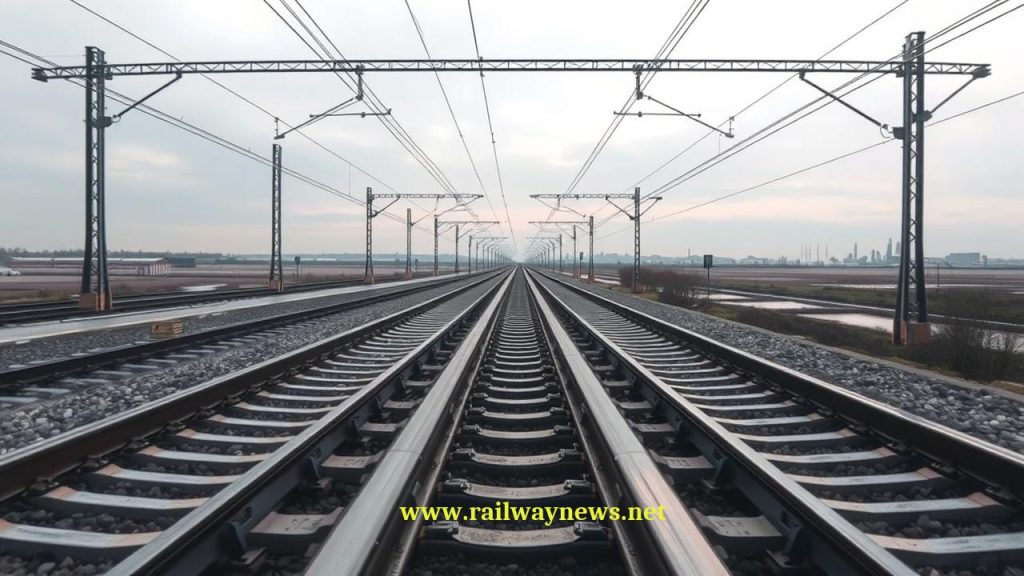
Rail loading gauge (European P/C series):
P/C70: 2,600 mm height — standard height only (2,591 mm) ✓
High-cube (2,896 mm) does NOT fit ✗
P400: 3,000 mm height — high-cube fits on low-loader wagon ✓
GB+: UK specific — 2,896 mm high-cube on UK lines ✓ (selected routes)
Key consequence: 60–70% of deep-sea containers arriving at
European ports are high-cube (9’6″) — P/C70 routes cannot
carry them → these containers MUST go by road inland
unless route is upgraded to P400 or better.
Swap Bodies and Semi-Trailers: The European Variants
While ISO containers dominate deep-sea and intercontinental intermodal, European domestic combined transport uses two additional loading unit types. Swap bodies (German: Wechselbehälter) are road vehicle bodies designed to be detached from the truck chassis and loaded onto a rail wagon by crane — they lack the ISO corner castings required for crane spreader bar lifting and instead use support legs and crane attachment points on the superstructure. They are typically 7.15 m, 7.45 m, or 7.82 m long — sized for European road transport regulations rather than ISO standards — and are the dominant unit on the German and Benelux combined transport market. Semi-trailers for Ro-Ro rail transport are complete road trailers (tractor unit detached) driven or towed horizontally onto specially designed rail wagons (Lohr Modalhor, ACTS) — the loading operation requires no crane but a dedicated Ro-Ro ramp and specific wagon designs. The Ferroutage service between Calais and Le Boulou (French motorway-by-rail service) loads complete trucks — tractor and trailer — onto low-floor wagons at drive-on ramps, representing the most infrastructure-intensive Ro-Ro variant.
Terminal Equipment: Cranes, Stackers, and Handling Systems
Rail Mounted Gantry Cranes (RMG)
The Rail Mounted Gantry crane — a steel portal structure spanning multiple rail tracks and truck lanes, running on rails embedded in the terminal apron — is the workhorse of large inland intermodal terminals. Its essential characteristics are: lifting capacity of 40–65 tonnes (sufficient for any laden ISO container); span of 30–60 m (covering 3–5 rail tracks and 2–3 truck lanes simultaneously); travel speed along the runway of 2–4 m/s (covering the full terminal length); trolley speed across the span of 1.5–2.5 m/s; and hoisting speed of 0.5–1.0 m/s loaded (faster unloaded). A single RMG crane can perform approximately 25–35 lifts per hour under continuous operation, though planned maintenance intervals and truck positioning queuing reduce effective utilisation to 60–75% of theoretical maximum.
RMG crane cycle time calculation (train-to-truck transfer):
Travel to train position: 30 m at 3 m/s = 10 s
Trolley position over container: 15 m at 2 m/s = 7.5 s
Lower spreader bar: 4 m at 0.8 m/s = 5 s
Attach and lock spreader: 5 s (automated spreader)
Hoist container: 5 m at 0.6 m/s = 8.3 s
Travel to truck position: 20 m at 3 m/s = 6.7 s
Trolley position over truck: 10 m at 2 m/s = 5 s
Lower container onto truck: 4 m at 0.5 m/s = 8 s
Unlock spreader and release: 5 s
Return to start position: (concurrent with next truck positioning) ~20 s
Total active cycle time: ~80 seconds per lift (theoretical)
With positioning queuing and small delays:
Effective cycle: 120–180 seconds per lift
Lifts per hour (effective): 3,600 / 150 = 24 lifts/hour per crane
For a terminal receiving one 40-wagon train carrying 80 containers (2 per wagon):
Unload time (1 crane): 80 / 24 = 3.33 hours
Unload time (3 cranes, 3 rail tracks): 80 / (24 × 3) = 1.11 hours
Typical target: train turnaround < 2 hours → requires 2–3 cranes per train
Rubber Tyred Gantry Cranes (RTG) and Reach Stackers
Rubber Tyred Gantry cranes are operationally similar to RMGs but travel on rubber tyres rather than rails, allowing them to be repositioned between different crane lanes as demand shifts — valuable in terminals where the balance of rail and truck activity changes throughout the day. RTGs are typically wider (spanning 5–7 truck lanes) than RMGs and are the dominant crane type in port container terminals, where their mobility allows them to follow the shifting pattern of vessel unloading and truck collection. Their limitation compared to RMGs is lower positioning precision (±300 mm for RTG versus ±30 mm for RMG with GPS-assisted positioning), which requires more skilled operator intervention for precise container stacking.
Reach stackers — self-propelled vehicles with a telescopic boom and container spreader — are the primary handling equipment for smaller intermodal terminals where crane capital cost cannot be justified. A reach stacker can handle one container at a time and can stack containers 4 high in the storage area, but its cycle time (3–5 minutes per lift-and-place cycle) is 2–3 times longer than a crane for the same movement and requires a much wider working area (the reach stacker must drive between rows, requiring 6–8 m of access lane between stacks). Reach stackers cost approximately €700,000–900,000 each versus €3–6 million for an RMG, making them the economic choice for terminals handling fewer than 15,000 TEU per year.
Terminal Layout: How Capacity Is Created and Constrained
An intermodal terminal’s theoretical throughput capacity is determined by three interacting constraints: crane capacity (lifts per hour available), rail capacity (number and length of loading tracks), and storage capacity (TEU that can be held simultaneously in the yard). In a balanced terminal design, all three constraints reach their limit simultaneously — if any one is significantly below the others, it becomes the binding constraint and the other two are underutilised. In practice, most terminals are constrained by one of the three, and identifying which one is the primary investment priority for capacity expansion.
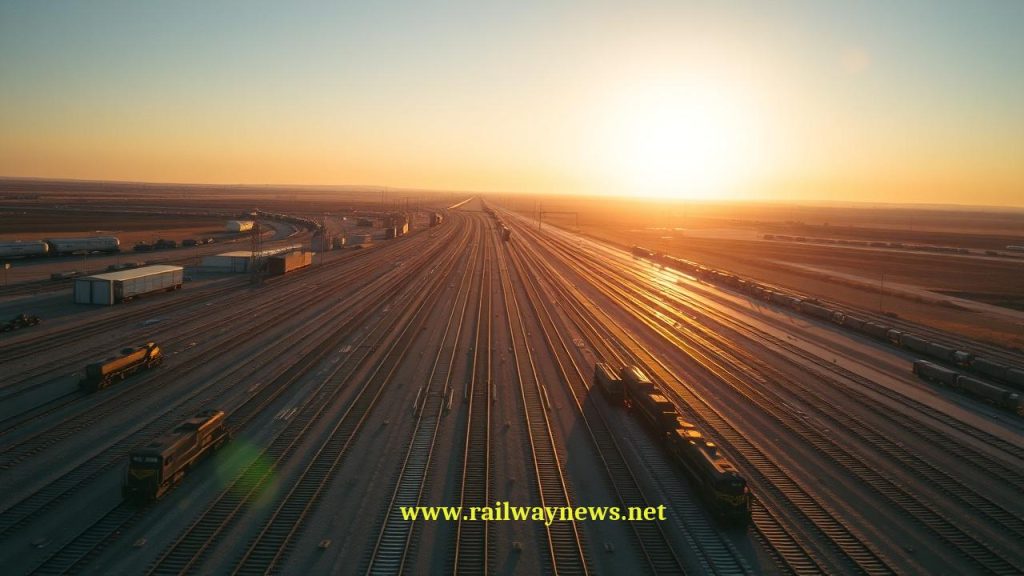
Rail Track Length: The Long-Train Premium
A train of 750 m length carrying 90 × 40 ft containers (180 TEU) requires exactly 750 m of clear platform track — but the train must also clear the entry point at one end and have room for the locomotive at the other. An effective loading track must be approximately 850–900 m to serve a 750 m train. In Europe, where many inland terminals were built in the 1970s–1980s for trains of 400–600 m, the length of existing tracks is frequently the binding constraint on throughput: a terminal with three tracks of 600 m can only handle trains of 55 wagons, while a competitor with three tracks of 750 m handles the same number of trains but with 90 wagons each — 64% more TEU per train path and per crane cycle. Track extension to 750 m and eventually 1,000 m (to match the maximum train lengths possible on upgraded EU corridors) is one of the highest-return capital investments available to an inland terminal operator.
The Gate Complex: OCR and Truck Appointment Systems
The terminal gate — the entry and exit point for road vehicles — is the interface between the terminal’s internal logistics and the external road network. A modern gate complex uses optical character recognition (OCR) cameras to automatically read container numbers and truck licence plates as they enter, verifying the container’s booking, checking for customs releases and phytosanitary certificates, and assigning the truck to a specific crane lane and time slot. The truck appointment system (TAS) pre-books each truck for a 30-minute time window, spreading truck arrivals evenly across the operating day and eliminating the peak-hour queues that characterise terminals without TAS. Terminal operators with TAS report 40–60% reductions in average truck gate waiting time compared to open-access terminals, and corresponding reductions in fuel consumption and emissions from trucks queuing on terminal approach roads.
The Modal Shift Carbon Arithmetic: Why Rail Intermodal Matters
The environmental case for intermodal rail freight rests on the difference in specific CO₂ emissions between road and rail freight — typically quoted as rail emitting approximately 3–4 times less CO₂ per tonne-kilometre than road. This ratio is real but context-dependent, and the actual carbon saving from a modal shift depends critically on the length of the rail haul versus the road segments at each end.
CO₂ comparison: road vs intermodal rail freight
Specific emissions (EN 16258 methodology):
Road (HGV 40t, Euro VI): 76 g CO₂/tonne-km
Rail freight (European average): 22 g CO₂/tonne-km
Electrified rail (renewables): 4–8 g CO₂/tonne-km
Example: London to Lyon container, 1,100 km
Full road: 1,100 km × 76 g/t-km × 20 t (payload) = 1,672 kg CO₂
Intermodal: London terminal → Lyon terminal = 900 km rail
Road collection + delivery: 100 km each end
Rail leg: 900 × 22 × 20 = 396,000 g = 396 kg
Road legs: 200 × 76 × 20 = 304,000 g = 304 kg
Total intermodal: 700 kg CO₂
CO₂ saving: 1,672 − 700 = 972 kg CO₂ = 58% reduction
If electrified rail (renewables-powered) at 6 g/t-km:
Rail leg: 900 × 6 × 20 = 108,000 g = 108 kg
Total: 108 + 304 = 412 kg → 75% reduction vs full road
Break-even distance (where intermodal matches full road CO₂):
Setting intermodal total = road total:
d_rail × 22 + 200 × 76 = (d_rail + 200) × 76
d_rail × 22 = d_rail × 76 − 200 × 76 + 200 × 76 = d_rail × 76
→ intermodal always lower CO₂ for any positive d_rail
(even d_rail = 1 m saves CO₂, because rail g/t-km < road g/t-km)
BUT: modal transfer adds time cost of ~2–4 hours per terminal
At 2 terminals: 4–8 hours added to total transit time
Break-even transport time (intermodal competitive with road):
Minimum viable rail haul: typically 300–400 km for competitive
total journey time including terminal dwell.
Terminal Automation: AGVs, ASCs, and the Fully Automated Terminal
The leading edge of intermodal terminal technology is the fully automated container terminal, in which all horizontal transport within the terminal (container movement between crane and storage area) is performed by Automated Guided Vehicles (AGVs) or Automated Stacking Cranes (ASCs), with cranes operated remotely from a control room rather than by an operator in the crane cab. The Rotterdam Maasvlakte II terminals (APM Terminals Maasvlakte II and Rotterdam World Gateway) represent the current state of commercial deployment: fully automated AGV-plus-ASC terminals processing 5 million TEU per year with a workforce of approximately 250 people — compared to approximately 600–700 for a conventional manual terminal of equivalent throughput.
For inland rail intermodal terminals (as distinct from port terminals), full automation is less advanced due to the more complex vehicle mix (trucks of varying lengths, heights, and booking patterns arriving non-uniformly, versus containerships arriving on planned schedules at port terminals). The inland terminal automation frontier is the automated RMG crane — replacing the cab-operated crane with a remote-operated or fully automated system using laser scanners and vision systems for container position detection. DB Netz’s terminal at Duisburg (one of the largest inland container terminals in Europe, processing over 300,000 TEU per year) began a phased RMG automation programme in 2021, with target completion of remote crane operation on all tracks by 2026. The anticipated labour saving is approximately 35–40% of crane operating staff, with a projected cycle time improvement of 8–12% from elimination of operator fatigue effects.
Intermodal Terminal vs Marshalling Yard vs Port Terminal: Full Comparison
| Parameter | Inland Intermodal Terminal | Port Container Terminal | Marshalling Yard (Hump) |
|---|---|---|---|
| Primary unit handled | ISO container, swap body, semi-trailer (TEU) | ISO container (TEU) | Individual freight wagon |
| Modal exchange | Rail ↔ Road | Sea ↔ Rail/Road | Rail ↔ Rail (sorting only) |
| Primary lifting equipment | RMG crane or reach stacker | Quay crane (STS) + RTG/ASC | No crane — gravity retarders |
| Train type served | Block trains (point-to-point) | Block trains (port-to-inland hub) | Mixed freight (wagonload) |
| Target train turnaround | 1.5–3 hours | 4–12 hours (vessel-dependent) | Not applicable (wagons sorted, not trains) |
| Throughput measure | TEU per year or lifts per hour | TEU per year or moves per crane per hour | Wagons per day |
| Key bottleneck | Crane capacity or track length | Quay crane rate or vessel schedule | Hump throughput or retarder reliability |
| Capital cost (medium facility) | €20–80 million | €200–800 million | €50–200 million |
| 24/7 operation? | Increasingly — required for train schedule compliance | Yes — vessel arrival independent of time | Yes — continuous for large yards |
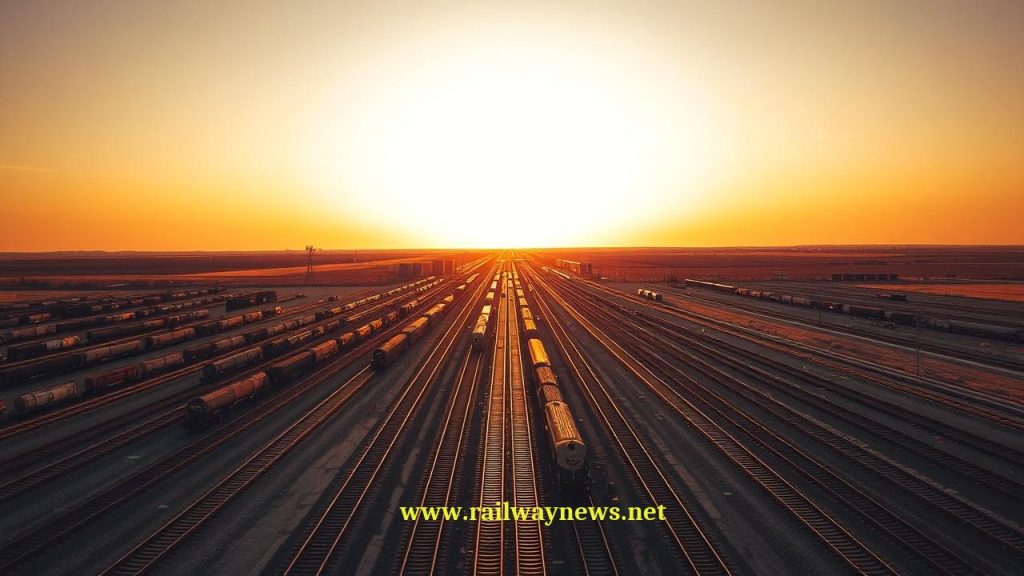
Key Intermodal Terminals: Global Examples
| Terminal | Location | Annual TEU | Rail Connections | Notable Feature |
|---|---|---|---|---|
| APM Terminals Maasvlakte II | Rotterdam, Netherlands | 4.7 million TEU/year | Betuwe Route to German Rhine-Ruhr; direct rail connection to Duisburg | Fully automated AGV + ASC terminal; zero diesel fuel in terminal operations; 250 staff for 4.7M TEU throughput |
| Duisburg Hafen (DIT) | Duisburg, Germany | 4 million TEU/year (trimodal — river barge, rail, road) | 18 rail connections; hub for China–Europe block trains | World’s largest inland port by throughput; key node for New Silk Road; 40 China–Europe trains/week; RMG automation programme 2021–2026 |
| Lawley Street (Freightliner) | Birmingham, UK | ~350,000 TEU/year | Direct services to Felixstowe, Southampton, London Gateway | Oldest Freightliner terminal in UK (1967 origin); 3 × 750 m rail tracks; key node for UK automotive parts supply chain; expanded 2023 to handle additional Felixstowe overflow |
| Khorgos Gateway (KTZ/COSCO) | Kazakhstan/China border | ~400,000 TEU/year and growing | 1,520 mm gauge (Kazakhstan) ↔ 1,435 mm gauge (China) | Largest dry port on China–Europe rail corridor; gauge-change facility (crane transfer + bogie exchange); SEZ with warehousing and light manufacturing; handled surge in China–Europe rail traffic during COVID-19 (2021 peak) |
| Trafford Park (DB Cargo UK) | Manchester, UK | ~280,000 TEU/year | Felixstowe, Southampton, London Gateway, Teesport | 5 × 750 m tracks; P400 gauge clearance for high-cube containers (one of few UK inland terminals with full high-cube capability); 24/7 operation; electrified crane runway |
| Brétigny-sur-Orge (Captrain/Rail Logistics) | Near Paris, France | ~120,000 TEU/year | Le Havre, Marseille, Lyon | P400 gauge route to Le Havre — one of the few P400 rail connections in France, enabling high-cube container movement from France’s largest port; subject of ongoing TEN-T corridor gauge upgrade discussion |
Editor’s Analysis
The Felixstowe congestion of 2021 should have permanently changed how European governments think about intermodal terminal capacity. It did not. Port and inland intermodal terminals in the UK and France remain chronically under-invested relative to what the modal shift targets in national freight strategies implicitly require. The arithmetic is unforgiving: if France is serious about doubling rail freight modal share from 9% to 18% by 2030 (as stated in its LOM — Loi d’orientation des mobilités), it needs to double the capacity of its rail intermodal terminal network — the physical infrastructure through which every container and swap body must pass when moving from road to rail. There is no mechanism for achieving this that does not require either new terminals, extended tracks at existing terminals, or gauge upgrades on the routes that serve them. None of these investments are cheap, fast, or politically glamorous. A 750 m track extension at an inland terminal costs €2–5 million and takes 18–24 months from design to operation. A P400 gauge upgrade on a key 100 km trunk route costs €50–150 million and takes 5–10 years. EU CEF (Connecting Europe Facility) funding covers a portion of these costs, but the absorption rate — the speed at which member states can programme and execute the projects — has consistently fallen short of the funding availability. The Khorgos Gateway story is, in this context, a useful contrast: built from essentially nothing in 2015 to 400,000 TEU per year in 2021, driven by a combination of Chinese investment and Kazakhstani state urgency. European terminal capacity grows at a fraction of that pace, constrained by planning consents, environmental impact assessments, and the institutional fragmentation between port authorities, infrastructure managers, and terminal operators that makes aligned investment decisions difficult to execute. The containers are there. The trains are there. The freight-paying customers are there. The infrastructure to connect them is not growing fast enough.
— Railway News Editorial
Frequently Asked Questions
1. What is the difference between a Lo-Lo terminal and a Ro-Ro terminal — and when would an operator choose each?
Lo-Lo (Lift-on/Lift-off) terminals use cranes to lift containers or swap bodies vertically — the container is raised from the wagon by a crane spreader bar, moved horizontally, and lowered onto a truck or into storage. Ro-Ro (Roll-on/Roll-off) terminals allow road vehicles (trailers, swap bodies on their own wheels or dollies, and in some cases complete truck-and-trailer combinations) to drive horizontally onto and off rail wagons via a ramp, without any crane involvement. The choice between them is determined by the cargo type, the available equipment, and the economics of the operation. Lo-Lo is more capital-intensive (cranes are expensive) but is faster per unit for large volumes — an automated RMG crane can process 24 containers per hour, while a Ro-Ro ramp can handle one vehicle at a time (approximately 4–6 per hour). Lo-Lo terminals handle any crane-liftable container or swap body; Ro-Ro terminals can handle oversize, liquid-filled, or fragile trailers that cannot be safely lifted by crane. On high-volume block-train corridors (port to inland hub, carrying 80–100 containers per train), Lo-Lo is always more efficient. On niche or time-sensitive automotive or temperature-controlled flows where the trailer itself is the loading unit and cannot be decanted into an ISO container, Ro-Ro is the only practical option. The French Ferroutage (motorway-by-rail) service uses an extreme form of Ro-Ro — loading complete trucks and trailers together — which is the most capital-intensive terminal design but the most cargo-agnostic, handling anything that can be driven onto a wagon.
2. What is a “block train” and why does intermodal freight almost exclusively use block trains rather than the wagonload network?
A block train (also called a unit train or point-to-point train) is a train that runs intact from its origin terminal to its destination terminal without any intermediate shunting, marshalling, or wagon sorting. Every wagon in the train is bound for the same destination — typically the same inland terminal or port terminal. The train assembles at the origin, runs non-stop (or with minimal operational stops), and is unloaded in its entirety at the destination. This contrasts with the traditional wagonload network, in which individual wagons from different origins and bound for different destinations are assembled into trains at marshalling yards, sorted multiple times en route, and individually delivered. Block trains are the dominant model for intermodal freight for four reasons. Speed: a block train from Felixstowe to Manchester takes 4–6 hours; an equivalent journey via the wagonload network would take 18–36 hours due to marshalling stops. Reliability: a block train has a single timing that can be tracked; a wagonload shipment’s transit time is variable by ±several hours due to marshalling delays. Cost: block trains eliminate marshalling cost entirely — the train never needs to enter a hump yard. And simplicity: from the shipper’s perspective, the container goes into a box at one end and comes out at the other — the complexity of the railway’s internal operations is invisible. The shift from wagonload to block trains was the structural change that made rail competitive with road for container freight in the 1990s–2000s, and the continued dominance of block trains reflects the inherent advantage of the simple, direct model over the complex, many-stop wagonload alternative.
3. How does the OCR (Optical Character Recognition) gate system work — and what happens when a container number is misread or a booking doesn’t match?
The OCR gate system at an intermodal terminal automatically reads container identification numbers as trucks enter the terminal, using high-resolution cameras positioned at the gate lanes. The container number (a standardised 11-character code per ISO 6346 — 4 letters indicating owner code and equipment type, followed by 6 digits plus a check digit) is printed on all four sides and both ends of every ISO container in standardised font and minimum size. The OCR camera captures images of the container’s number, the truck’s licence plate, and the container’s physical condition (a low-resolution damage assessment from 4 cameras covering all container faces), and transmits these to the Terminal Operating System (TOS) within approximately 3–5 seconds of the truck entering the gate lane. The TOS cross-references the read container number against the electronic booking (the pre-advised container number, weight, and destination provided by the shipping line or freight forwarder), confirms the booking is valid and the customs release (or equivalent) is in order, and issues the truck with a crane lane assignment. If the OCR misreads a digit (a common occurrence with dirty, shadowed, or damaged container numbers), the system flags the discrepancy and routes the truck to a manual check lane where a gate clerk manually verifies the number from the booking documents. If the container number is valid but there is no matching booking (the shipper forgot to pre-advise), the truck is again directed to manual processing while the gate clerk contacts the freight forwarder. The average gate processing time for a correctly pre-booked container is 30–60 seconds; for an exception requiring manual resolution, 5–15 minutes — which is why un-booked or incorrectly booked containers represent a disproportionate share of gate congestion at busy terminals.
4. What is the “drayage problem” in intermodal logistics — and why is first-mile/last-mile truck transport such a persistent constraint on rail intermodal competitiveness?
The drayage problem — the inefficiency and cost of the short road movement between the shipper’s premises and the nearest intermodal terminal — is the most persistent constraint on rail intermodal’s competitiveness with door-to-door road haulage. The fundamental issue is that rail’s cost and carbon advantage only applies to the portion of the journey that is on rail. The drayage segment (first-mile collection and last-mile delivery by truck) costs approximately the same per km as long-haul road haulage, but the journey is very short (typically 10–80 km), so the economies of scale that make rail cheap over 500+ km do not apply. The drayage cost for a standard 40 ft container in the UK is approximately £150–350 per movement, independent of the rail haul distance. For a 500 km rail haul, the all-in intermodal cost (drayage + terminal handling + rail freight + destination terminal + drayage) is approximately £600–800 per container — competitive with the equivalent road price of £700–900. But for a 250 km rail haul, the terminal handling and drayage costs represent a much larger fraction of the total, and the rail advantage narrows or disappears. This “minimum viable rail haul” of approximately 300–400 km is one of the structural reasons why rail intermodal’s market share in the UK (where the island’s geography limits hauls to ~800 km maximum) is lower than in France or Germany (where continental distances enable much longer hauls and thus lower drayage-to-rail-cost ratios). Solutions to the drayage problem include urban consolidation centres (reducing the number of drayage trips by aggregating deliveries), electric cargo bikes and vans for final delivery (reducing the cost and emissions of the last segment), and locating warehouses and distribution centres adjacent to intermodal terminals (eliminating the drayage entirely for largest shippers). The last approach — exemplified by the logistics parks built around Duisburg Hafen and Rotterdam Maasvlakte — is the most economically effective, but requires terminal operators to act as property developers as well as logistics operators.
5. What is the “New Silk Road” China–Europe rail service — and how has it changed the global role of European intermodal terminals?
The China–Europe block train services — commonly grouped under the Belt and Road Initiative (BRI) branding and operated by various Chinese and European logistics companies under Chinese Government subsidy — are regular scheduled freight train services connecting Chinese manufacturing cities (Chongqing, Chengdu, Xi’an, Zhengzhou, Wuhan, and others) to European destinations (Hamburg, Duisburg, Warsaw, Madrid, and others) via the Trans-Siberian Railway or through Central Asia and Kazakhstan. The journey covers approximately 10,000–12,000 km and takes 12–18 days, compared to 25–35 days for sea freight via the Suez Canal and 4–7 days for air freight. The rail service positions itself as the time-and-cost intermediate: faster than sea, cheaper than air, viable for higher-value goods (electronics, automotive parts, e-commerce) that cannot wait 30 days but are too heavy or bulky for air freight economics. From a European intermodal terminal perspective, the China–Europe services have created a new category of demand: trains arriving from the east carrying Chinese export goods in 40 ft containers, requiring crane discharge, customs clearance, and onward distribution by road or short-haul rail to European warehouses — and in the opposite direction, European exports (automobiles, chemicals, machinery) requiring collection and loading for the return eastbound journey. Duisburg, Hamburg, and Warsaw have all expanded their intermodal terminal capacity specifically to serve this demand. The flow peaked at approximately 15,000 trains in 2021 (a 22% increase over 2020, driven by COVID-related sea freight delays) and has moderated since as sea freight normalised, but remains a structurally important traffic type. The geopolitical vulnerability of the route — passing through Russia, which has been under Western sanctions since February 2022 — has led most major European logistics operators to route services via Kazakhstan, Caspian Sea ferry, and the Caucasus corridor (the “Middle Corridor”) rather than through Russian territory, adding transit time but reducing political risk.
Railway infrastructure, rolling stock and transport technologies specialist focused on global rail industry developments, high-speed rail systems, signaling technologies and freight transportation. Covering railway investments, public transport modernization, rail operations and international mobility projects across Europe, Asia and North America.
BENZER KONULAR
July 4, 2026 11:41 pm
Eurostar cancelled all direct London–Amsterdam trains through July 2 after...
July 1, 2026 1:37 pm
NRHS awarded $187K to 34 U.S. rail heritage projects in...
July 1, 2026 1:42 am
UK government launched a £30bn Better Connected plan, allocating £15.6bn...
July 1, 2026 6:37 am
Amtrak launched a small-plate dining program for Acela First Class...
July 1, 2026 8:49 am
The Short Line Training Center launched FRA-funded online DSLE and...
July 4, 2026 11:02 pm
Eurostar suspends all direct London–Dutch trains through 2 July after...