
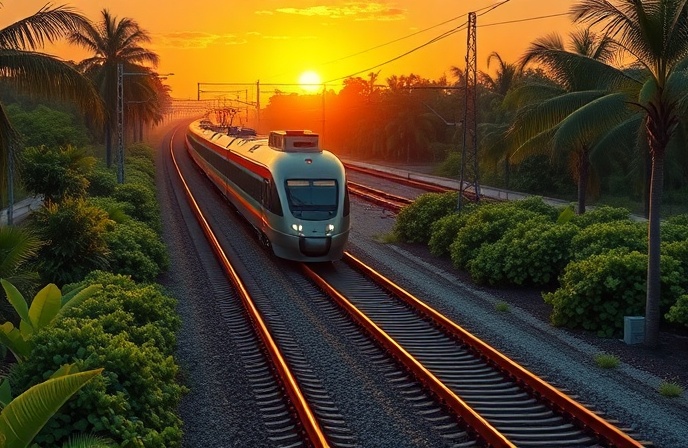
What is LiDAR in Railways? The Ultimate Guide to 3D Track Monitoring and Asset Management
A comprehensive technical guide to LiDAR (Light Detection and Ranging) in railway engineering. Discover how 3D laser scanning transforms track monitoring, structure gauging, vegetation management, and the creation of Digital Twins for predictive infrastructure maintenance.
⚡ In Brief
- LiDAR (Light Detection and Ranging) is a remote sensing technology that fires millions of laser pulses per second to create a precise three-dimensional point cloud of railway infrastructure at full line speed.
- A modern railway Mobile Laser Scanning (MLS) system travelling at 80 km/h can capture 1–2 million data points per second, producing a complete 3D digital record of track geometry, structure clearances, and lineside assets in a single pass.
- LiDAR has replaced manual track-walking as the primary method for structure gauge surveys, OLE geometry measurement, and vegetation encroachment detection on most major railway networks.
- When combined with GNSS positioning and inertial measurement units (IMU), railway LiDAR achieves absolute positioning accuracy of ±20–50 mm and relative measurement accuracy of ±5–10 mm — sufficient for clearance and gauge compliance surveys.
- The data from repeated LiDAR surveys is the primary input for railway Digital Twins — persistent 3D models of the infrastructure that enable change detection, predictive maintenance, and virtual new vehicle route approval.
In 2017, Network Rail needed to determine whether a new fleet of trains — the Hitachi Class 800 — could operate safely on the Great Western Main Line before the vehicles were delivered. The trains were wider and taller than the rolling stock they replaced. The question was whether hundreds of tunnels, bridges, and station canopies built in the Victorian era provided adequate clearance for the kinematic envelope of the new fleet.
Answering that question with traditional methods — sending engineers to measure every structure by hand — would have taken years and required thousands of track possessions. Instead, Network Rail used LiDAR-equipped measurement trains to capture the complete three-dimensional profile of the entire route, then fed that data into software that simulated the Class 800’s kinematic envelope passing through every structure. The survey that would have taken years was completed in weeks. Clearance issues were identified and resolved before a single revenue train ran. The Class 800 entered service on time.
This is LiDAR’s value to the railway industry: not just better measurement, but a fundamentally different relationship between infrastructure managers and their assets.
What Is LiDAR?
LiDAR (Light Detection and Ranging) is an active remote sensing technology that measures distances by firing laser pulses and recording the time taken for each pulse to return after reflecting from a surface. The distance to each reflection point is calculated from the time of flight (ToF) of the pulse, using the known speed of light. By firing millions of pulses per second in a rotating or oscillating pattern, a LiDAR sensor builds up a dense three-dimensional dataset — a point cloud — of every surface within its scanning range.
Unlike a photograph, which captures colour and appearance, a LiDAR point cloud captures geometry — the precise X, Y, and Z coordinates of every point on every surface. A tunnel lining, a rail head, a catenary mast, a signal post, and a tree branch are all represented by their actual three-dimensional positions to millimetre accuracy.
How Railway LiDAR Works: The Complete Measurement Chain
| Component | Function | Typical Specification |
|---|---|---|
| LiDAR scanner(s) | Emits laser pulses and records returns; builds point cloud | 0.5–2 million points/second; range 50–300 m; accuracy ±5 mm |
| GNSS receiver | Provides absolute geographic position | RTK GNSS; ±20–50 mm absolute position (degrades in tunnels) |
| IMU (Inertial Measurement Unit) | Records vehicle attitude (pitch, roll, yaw) to correct for vehicle motion | Tactical-grade; 100–1,000 Hz sample rate |
| Odometer / track encoder | Provides track chainage (distance along route) | ±0.1% distance accuracy; supplements GNSS in tunnels |
| Ground control / track reference | Known-position reference points to calibrate absolute position | Reflective targets or known structure features surveyed by GNSS |
| Processing software | Fuses all sensor data; produces georeferenced point cloud | Combines SLAM, point cloud registration, and asset extraction algorithms |
Types of Railway LiDAR Systems
| System Type | Platform | Operating Speed | Point Density | Best Application |
|---|---|---|---|---|
| MLS (Mobile Laser Scanning) | Measurement train or hi-rail vehicle | Up to 120 km/h | 500–2,000 pts/m² | Network-wide clearance, track geometry, OLE, asset inventory |
| ALS (Aerial Laser Scanning) | UAV drone or helicopter | UAV: 20–80 km/h; helicopter: 60–120 km/h | 5–50 pts/m² | Vegetation management, embankment stability, flood risk |
| TLS (Terrestrial Laser Scanning) | Fixed tripod on or near track | Static (track possession required) | 1,000–10,000 pts/m² | Bridge structural surveys, complex junctions, station as-built |
| Onboard perception LiDAR | Revenue train or autonomous vehicle | Revenue service speed | Variable (real-time processing) | Obstacle detection, platform gap measurement, GoA4 perception |
Key Railway Applications
1. Structure Gauge and Clearance Analysis
The most safety-critical application of railway LiDAR is structure gauge compliance — confirming that fixed infrastructure provides adequate clearance for the kinematic envelope of trains operating on the route. LiDAR captures the complete three-dimensional profile of every tunnel, bridge, platform edge, OLE structure, and signal post along a route. Software then sweeps the vehicle’s kinematic envelope — accounting for body roll, suspension travel, and curve geometry — through the captured point cloud, identifying any point where the envelope intersects a fixed structure.
This “clash detection” analysis identifies clearance violations to ±5 mm accuracy at full line speed, without any manual measurement at individual structures. A complete gauge survey of a 100 km route that previously required 6–12 months of manual measurement and possession-intensive access can now be completed in 2–3 measurement train passes taking a total of a few hours of track time.
2. OLE Geometry Measurement
The contact wire height, stagger, and wear are safety-critical parameters that must remain within defined limits. Traditional OLE inspection required dedicated measurement vehicles equipped with contact measurement systems or walking inspectors with hand-held gauges. LiDAR from a measurement train can capture the complete OLE geometry — contact wire height at every mast span, stagger at every registration point, and wire sag between supports — continuously at line speed.
The data is processed against design tolerances, automatically flagging sections where wire height is below minimum (risk of pantograph impact on structures) or above maximum (risk of pantograph loss of contact), and sections where stagger exceeds permitted limits (risk of pantograph dewirement).
3. Vegetation Management
Vegetation encroachment — trees and vegetation growing into the railway safety zone — is one of the most common causes of service disruption on rural networks. LiDAR can differentiate between “hard” returns (structures, ballast, rails) and “soft” returns (vegetation) by analysing the characteristics of the reflected pulse. Vegetation returns are typically more diffuse and less intense than hard surface returns.
Aerial LiDAR from drones produces a three-dimensional model of the vegetation canopy alongside the track. Analysis software calculates the minimum clearance between vegetation and the structure gauge envelope, identifying trees and branches that are encroaching or at risk of encroaching after growth. Maintenance teams receive targeted work orders specifying exactly which trees to trim, eliminating the need for blanket corridor-wide vegetation clearance programmes.
4. Track Geometry and Ballast Profiling
High-density LiDAR pointed downward from a measurement train captures the three-dimensional profile of the ballast shoulder and track formation. Comparison between successive surveys identifies sections where ballast has been compacted or eroded, where track has settled, and where the ballast shoulder profile no longer meets the specification required for effective drainage and track stability.
This ballast profile data directly informs tamping programme planning — instead of tamping the entire route on a fixed schedule, engineers can target tamping resources at sections where track geometry has degraded below threshold, transitioning from time-based to condition-based maintenance.
5. Digital Twin Creation and Asset Inventory
The most transformative long-term application of railway LiDAR is the creation of Digital Twins — persistent, accurate three-dimensional models of the infrastructure that are updated with each measurement pass. A Digital Twin built from LiDAR data contains not just geometry but a classified inventory of every detectable asset: mast positions and heights, signal locations, bridge spans, platform edges, level crossing positions, drainage structures, and kilometre posts.
This classified asset inventory is the foundation of BIM (Building Information Modelling) workflows — enabling engineers to virtually design new infrastructure, simulate the effects of maintenance interventions, and check clearances for new rolling stock without visiting site. When a new train type is being considered for a route, its kinematic envelope can be swept through the Digital Twin rather than requiring a physical route-learning run.
LiDAR vs Photogrammetry: Choosing the Right Technology
| Parameter | LiDAR | Photogrammetry | Combined (Best Practice) |
|---|---|---|---|
| Geometric accuracy | High (±5–10 mm) | Medium (±10–50 mm) | High |
| Works in darkness / tunnels | Yes — active sensor | No — requires illumination | LiDAR leads in tunnels |
| Vegetation penetration | Yes — pulses reach ground through canopy gaps | No — sees top of canopy only | LiDAR leads for vegetation |
| Visual texture / colour | None (intensity only) | Excellent — photorealistic output | Photogrammetry adds colour |
| Asset classification | Geometry-based — structure type from shape | Appearance-based — structure type from colour/texture | Combined enables higher accuracy AI classification |
| Data volume | Very large (TB per 100 km) | Large (hundreds of GB per 100 km) | Combined is largest |
| Cost per km | Higher (specialised equipment) | Lower (camera-based) | Highest |
AI and Machine Learning: Automating Point Cloud Analysis
The primary operational challenge of railway LiDAR is not data collection — it is data processing. A single measurement train pass produces terabytes of point cloud data. Manual analysis of this data is slow and expensive; automated analysis using AI and machine learning is transforming what is practical at scale.
Modern railway LiDAR processing pipelines use deep learning algorithms to automatically classify point clouds — separating rails, sleepers, ballast, OLE, structures, and vegetation without human intervention. Once classified, asset extraction algorithms identify and locate individual assets: each catenary mast, each signal, each bridge structure. Change detection algorithms compare consecutive survey epochs and flag any geometric changes above a threshold — a bridge abutment that has moved, a section of OLE wire that has sagged, a tunnel lining crack that has widened.
Network Rail’s Network Survey Vehicle and the European Commission’s Shift2Rail programme have demonstrated automated classification accuracy rates exceeding 95% for principal asset categories, enabling a measurement train pass to produce a fully classified asset update to the Digital Twin within hours of the survey being completed.
Editor’s Analysis
LiDAR has transformed railway asset management from an episodic, manual activity into a continuous, automated data stream — and the industry has barely begun to exploit the implications. The technology to scan an entire national railway network in three to four weeks, producing a complete classified Digital Twin updated with every survey cycle, is commercially available today. The barriers are not technical but organisational: the data management infrastructure to store and process terabytes of point cloud data continuously, the workflows to act on automated change detection alerts before they become maintenance problems, and the cultural shift from inspection-by-walking to inspection-by-data. The next frontier is onboard LiDAR on revenue trains — every train a measurement platform, scanning the infrastructure it passes through in service. Several operators are running trials where standard passenger trains carry LiDAR payloads that collect geometric data on every trip, feeding continuous updates into the Digital Twin. The economic logic is compelling: the marginal cost of adding a sensor to a train already running the route is tiny compared to the cost of a dedicated measurement train possession. If routine perception data from every train can replace specialist survey cycles for routine monitoring, while specialist vehicles are reserved for high-accuracy targeted surveys, the total cost of maintaining infrastructure knowledge drops dramatically. That is the future of railway asset management — and LiDAR is its foundation. — Railway News Editorial
Frequently Asked Questions
- Q: What is a point cloud and how is it used in railway engineering?
- A point cloud is a dataset of millions (or billions) of individual points in three-dimensional space, each with X, Y, Z coordinates and typically an intensity value reflecting how strongly the laser pulse reflected from that surface. In railway engineering, the point cloud is a complete digital replica of the physical environment — every rail, sleeper, mast, tunnel wall, and tree branch is represented by its actual position in space to millimetre accuracy. Engineers use point cloud data to measure clearances, extract asset positions, detect geometric changes, and build Digital Twins. Point cloud data is processed using specialist software (such as Leica Cyclone, ESRI ArcGIS, or custom railway asset management platforms) that enables measurement, classification, and change detection analysis.
- Q: How does LiDAR work inside tunnels where GNSS signals cannot penetrate?
- Inside tunnels, GNSS signals are unavailable — satellite signals cannot penetrate the tunnel structure. Railway LiDAR systems use a combination of inertial navigation (the IMU continues tracking position using acceleration and rotation data), odometry (wheel rotation counting provides distance along the track), and SLAM (Simultaneous Localisation and Mapping — an algorithm that uses the structure of the point cloud itself to track position by matching observed features to a developing map). At tunnel portals, GNSS position is re-acquired and used to correct any accumulated inertial drift. For long tunnels, absolute position references — reflective targets at known positions surveyed by other means — are placed inside the tunnel to provide correction points.
- Q: How often should a railway network be re-surveyed with LiDAR?
- Survey frequency depends on the rate of change of the infrastructure and the consequence of undetected change. High-speed lines and busy urban routes typically benefit from annual or biennial full LiDAR surveys, with more frequent targeted surveys of known problem areas. Vegetation-heavy rural routes may require seasonal surveys to capture growth cycles. With the emerging trend of onboard LiDAR on revenue trains, continuous survey data may become available for major routes — effectively providing a monthly or weekly updated Digital Twin. Network Rail’s current practice is an annual full-network survey using measurement trains, supplemented by targeted surveys for specific projects or concerns.
- Q: Can LiDAR detect rail defects such as cracks?
- Standard railway LiDAR is not the primary tool for detecting rail internal defects such as fatigue cracks — those require ultrasonic testing, which uses sound waves that penetrate the rail. LiDAR is very effective at detecting rail surface defects: corrugation (periodic surface wear creating roughness), head checking (fine surface cracks visible as geometric irregularities), and rail wear (loss of cross-sectional profile). For internal defects, ultrasonic testing systems — either purpose-built ultrasonic test trains or hand-pushed ultrasonic trolleys — remain the primary detection method. Modern inspection vehicles increasingly combine LiDAR for surface geometry measurement with ultrasonic testing for internal defect detection in a single measurement pass.
- Q: What is the difference between a Digital Twin and a BIM model in railway applications?
- BIM (Building Information Modelling) is a structured approach to managing the geometric, functional, and maintenance data of built assets through their lifecycle. A railway BIM model is a structured database of asset information — locations, dimensions, materials, maintenance history — linked to a three-dimensional geometric representation. A Digital Twin is a BIM model that is continuously updated with real-world sensor data to reflect the current state of the physical asset — not just its design intent. LiDAR surveys are the primary mechanism for keeping the geometric component of a railway Digital Twin current: each survey cycle updates the model with the actual measured geometry, rather than the design geometry. The Digital Twin enables predictive maintenance by comparing current geometry against design intent and triggering alerts when deviation exceeds defined thresholds.
Railway infrastructure, rolling stock and transport technologies specialist focused on global rail industry developments, high-speed rail systems, signaling technologies and freight transportation. Covering railway investments, public transport modernization, rail operations and international mobility projects across Europe, Asia and North America.
RELATED POSTS
July 4, 2026 11:41 pm
Eurostar cancelled all direct London–Amsterdam trains through July 2 after...
July 1, 2026 1:37 pm
NRHS awarded $187K to 34 U.S. rail heritage projects in...
July 1, 2026 1:42 am
UK government launched a £30bn Better Connected plan, allocating £15.6bn...
July 1, 2026 6:37 am
Amtrak launched a small-plate dining program for Acela First Class...
July 1, 2026 8:49 am
The Short Line Training Center launched FRA-funded online DSLE and...
July 4, 2026 11:02 pm
Eurostar suspends all direct London–Dutch trains through 2 July after...